A comprehensive interpretation of the global rigid CCL industry in 2018
Main points of Global Rigid Copper Clad Laminate Industry
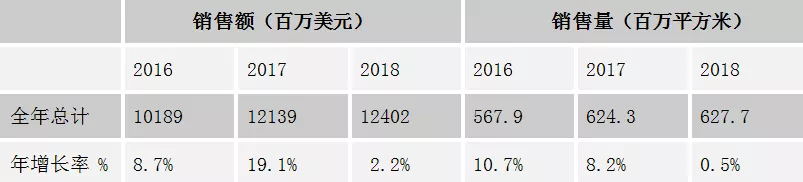
According to Prismark's statistics in June 2019, global sales of rigid copper clad laminates reached 12.402 billion US dollars in 2018 (see Fig. 1 and Table 1), with an annual growth rate of 2.2%. After double-digit growth in the only year of 2017 (19.1%), 2018 returned to the original trend of "slow growth".
In 2018, global sales of special and special resin-based copper clad laminates (mainly high-frequency and high-speed copper clad laminates and base plate materials for packaging) amounted to $2962 million, with a growth rate of 16.4% in 2017. By 2018, the momentum of substantial growth was still rising, with a growth rate of 31.7% in 2018. Its share of global sales of rigid copper clad laminates increased from 18.5% in 2017 to 23.9%.
In 2018, the sales of rigid copper clad laminates in mainland China amounted to $8450 million, accounting for 68.1% of the total global sales, ranking first in the world. Its annual growth rate is the highest, 2.9 percentage points higher than the global annual growth rate.
01. Overview of Global Rigid Copper Clad Laminate Operation in 2018
In June 2019, Prismark, the authoritative statistical agency of the global PCB industry, released the latest survey report on the global production and marketing of rigid copper clad laminates, LAMINATE SUMMARY 2018 - UPDATE (June 2019). Prismark's statistics show that global sales of rigid copper clad laminates reached 12.402 billion US dollars in 2018 (see Fig. 1 and Table 1), with an annual growth rate of 2.2%. This growth rate data for 2018 shows that the annual sales of rigid copper clad laminates in the world since 2012 have returned to the original trend of "slow growth" in 2018 after a double-digit growth (19.1%) in the only year of 2017.
According to Prismark statistics, global sales of rigid copper clad laminates reached 627.7 million square meters in 2018, a slight increase of 0.5% over the 2017 output (624.3 million square meters).
Figure 1 Global and Mainland China Rigid Copper Clad Laminate Sales Change from 2012 to 2018
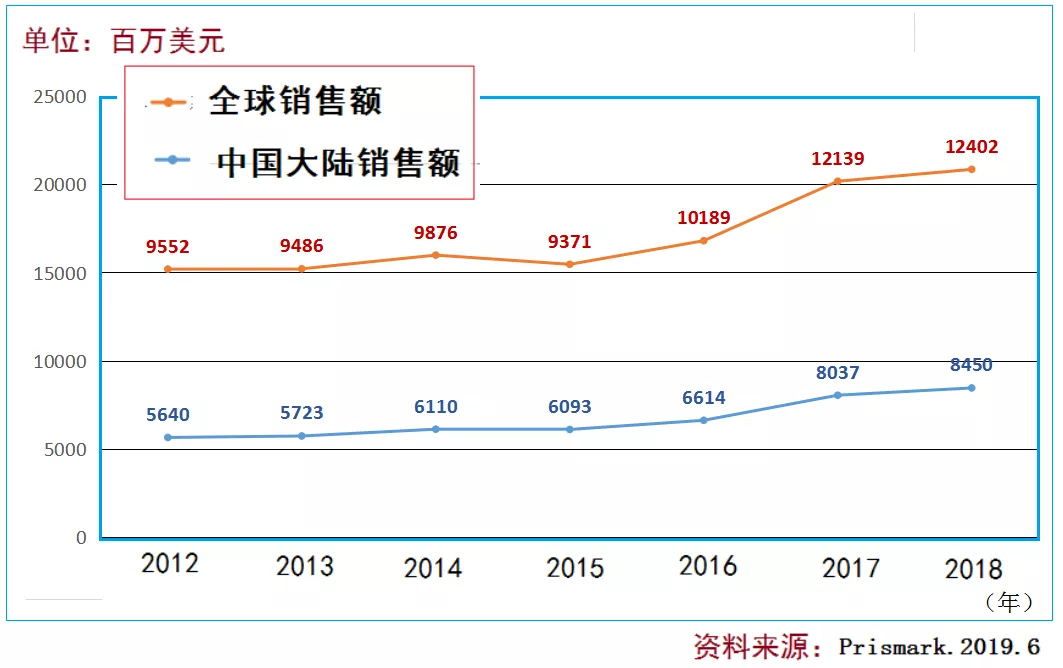
Table 1 Statistics of global sales and sales of rigid copper clad laminates from 2016 to 2018
Source: Prismark. 2019.6
Fig. 1 and Table 1 show global sales and sales of rigid copper clad laminates in 2018. We can introduce the average market price of rigid copper clad laminates in 2018. Compared with 2017, it increased by only 1.65% (the average market price in 2017 increased by 11.1% compared with 2016). It shows that the price of rigid copper clad laminate market in 2018 has the same trend of "stabilization" as the annual growth rate of sales and sales in that year.
02. Regional Distribution of Global Rigid Copper Clad Laminate Production and Marketing in 2018
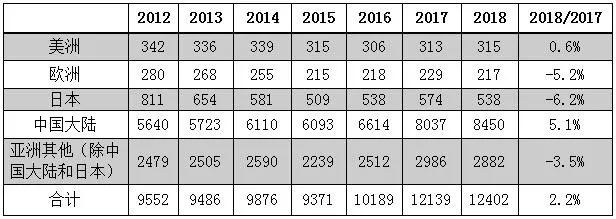
According to the statistics of rigid copper clad laminate production and marketing published by Prismark in June 2019 in major countries/regions in the world, China's sales in 2018 amounted to 8450 million US dollars, accounting for 68.1% of the total global sales, ranking first in the world. Its annual growth rate is 5.1%. Among the five major countries/regions of global copper clad laminate production, China mainland has the highest annual growth rate, which is 2.9 percentage points higher than the global annual growth rate.
In 2018, sales of rigid copper clad laminates in other parts of Asia (excluding Japan and mainland China) amounted to $2882 million. In 2016 and 2017, sales of rigid copper clad laminates in this region achieved double-digit growth rates (12.2% in 2016 and 18.9% in 2017), respectively, while the annual growth rate in 2018 was - 3.5%.
In 2018, sales of rigid copper clad laminates in Japan were $538 million, down 6.2% year on year. North America (mainly the United States) and Europe have maintained positive growth momentum for two consecutive years.
Table 2 Statistics of sales of rigid copper clad laminates in countries/regions of the world from 2012 to 2018 (Unit: $1 million)
Note: Including prefabricated panels with inner core for multilayer laminates and semi-curable panels (including prepreg)
Source: Prismark. 2019.6
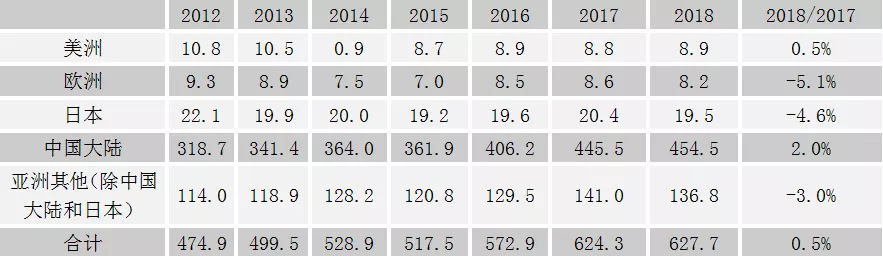
In 2018, sales of rigid copper clad laminates declined year-on-year in three other countries and regions except mainland China and the Americas, with negative annual growth rates. The sales volume of the mainland of China reached 454.5 million square meters in 2018, accounting for 72.4% of the total global sales volume, an increase of 2.0% over 2017, and maintained positive growth for three consecutive years.
In Europe, annual sales fell by 5.2% in 2018, and sales fell by 5.1% year-on-year, making it the region with the largest reduction in annual sales of rigid copper clad laminates in five countries/regions in the world in 2018. The annual growth rates of other parts of Asia (except China and Japan) and Japan in 2018 were - 3.0% and - 4.6%, respectively.
Table 3 Statistics of sales of rigid copper clad laminates (in acreage) in countries/regions of the world from 2012 to 2018
Unit: Million square meters
Note: Including prefabricated panels with inner core for multilayer laminates and semi-curable panels (including prepreg)
Source: Prismark. 2019.6
03. Statistics and Changes of Global Rigid Copper Clad Laminate Product Varieties and Structures in 2018
Prismark surveyed and counted sales of various rigid copper clad laminates in 2018, as shown in Figure 2.
Figure 2 Global sales statistics of various types of rigid copper clad laminates in 2017 and 2018
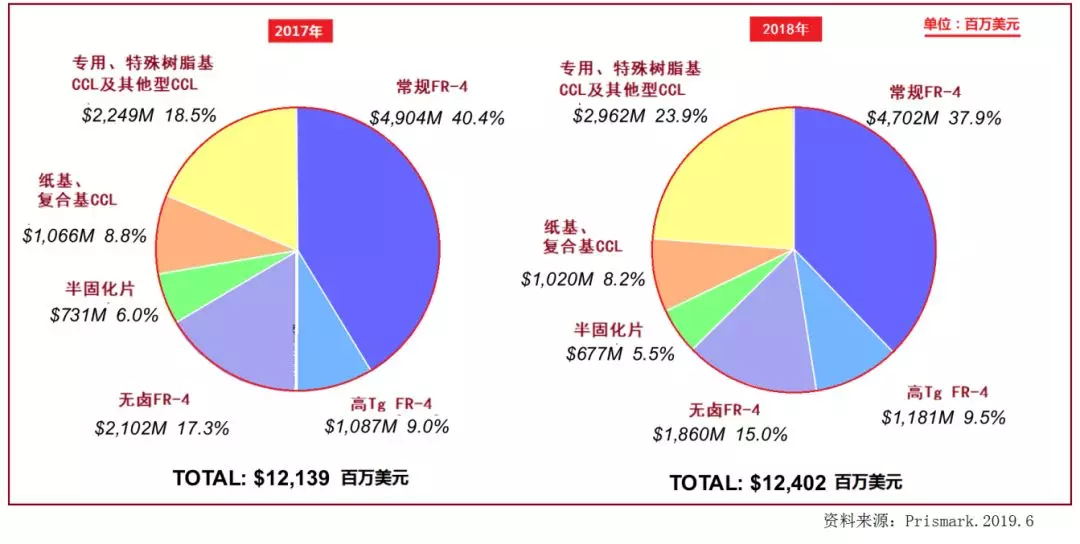
Table 4 Global sales and annual growth rates of rigid copper clad laminates from 2015 to 2018
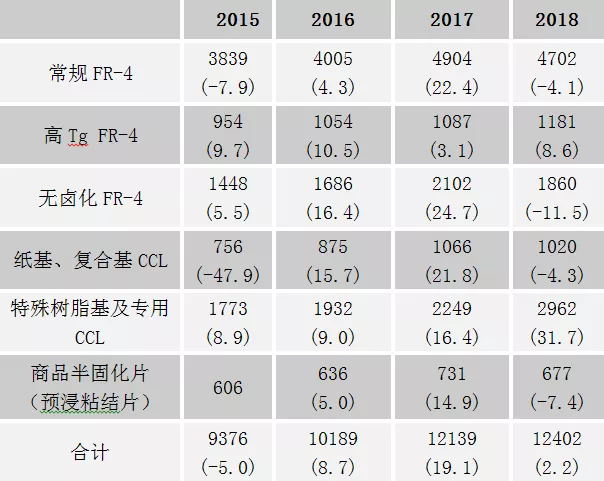
Note: In the table "()" is the annual growth rate.
Source: Prismark. 2016-2019
Figures 2 and 4 show that in 2018, global special and special resin-based copper clad laminates (mainly high-frequency and high-speed copper clad laminates and base plate materials for packaging) continued to grow rapidly, with sales reaching $2962 million and growth rate as high as 31.7% (the growth rate in 2017 was as high as 16.4%). It accounted for 18.5% of global sales of rigid copper clad laminates in 2017, up to 23.9%.
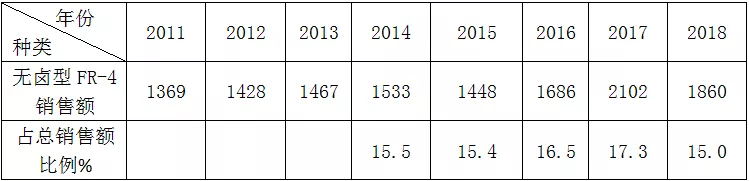
Global sales of conventional FR-4, paper-based and composite-based CCL, halogen-free FR-4 and semi-cured commercial sheets decreased in 2018 compared with 2017, respectively. Halogen-free FR-4 sales declined most seriously, with an annual growth rate of - 11.5% (see table 5). The annual growth rate of global high Tg FR-4 copper clad laminates in 2018 is the second highest growth rate among all kinds of CCLs.
Table 5 Global Halogen-Free FR-4 Copper Clad Sheet Sales and Proportion Statistics from 2011 to 2018
Unit: Million square meters
Source: Prismark. 2012-2019
Figure 3 Global sales of rigid halogen-free copper clad laminates and the proportion of each company in 2018
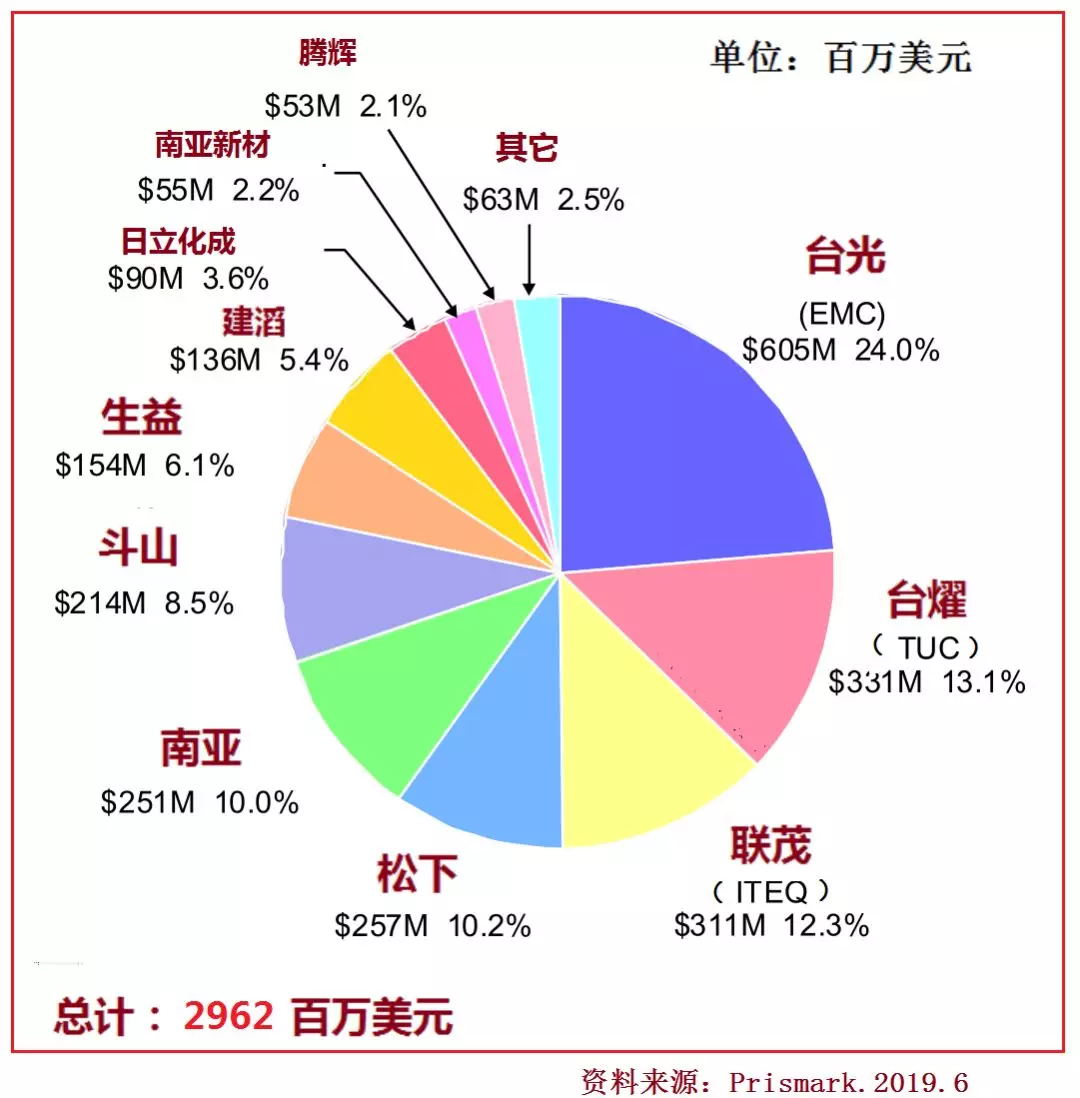
In 2018, global sales of special resin-based copper clad laminates reached $2962 million, and the growth rate reached 16.4% in 2017. By 2018, the momentum of substantial growth was still rising, with the growth rate as high as 31.7% in 2018. Special and special resin-based copper clad laminates (including metal-based copper clad laminates) are mainly high-speed/high-frequency laminates, packaging substrates, high heat-resistant laminates, etc.
In terms of resin structure, it includes BT resin-fiberglass cloth board, PPO resin-fiberglass cloth board, similar BT resin-fiberglass cloth board, hydride resin-fiberglass cloth board, PI resin-fiberglass cloth board, PTFE resin-fiberglass cloth board, PTFE resin-inorganic filler board, etc.
High-frequency and high-speed copper clad laminates, such as carbohydride resin-fiberglass sheet, PTFE resin-fiberglass sheet, PTFE resin-inorganic filler sheet and so on, have increased rapidly in market demand in recent two years, resulting in an increase in global sales of special and special resin-based copper clad laminates in recent two years, which accounted for only 18.9% of the total sales of rigid copper clad laminates from 2015 to 2001. Eight years have rapidly increased to 23.9% of total sales.
Table 6 Sales changes of special resin type copper clad laminates in 2011-2016
Unit: $1 million

The annual growth rate of global high Tg FR-4 copper clad laminates in 2018 is the second highest growth rate among all kinds of CCLs.
04. Global Sales List of Key Rigid Copper Clad Plate Enterprises in 2018
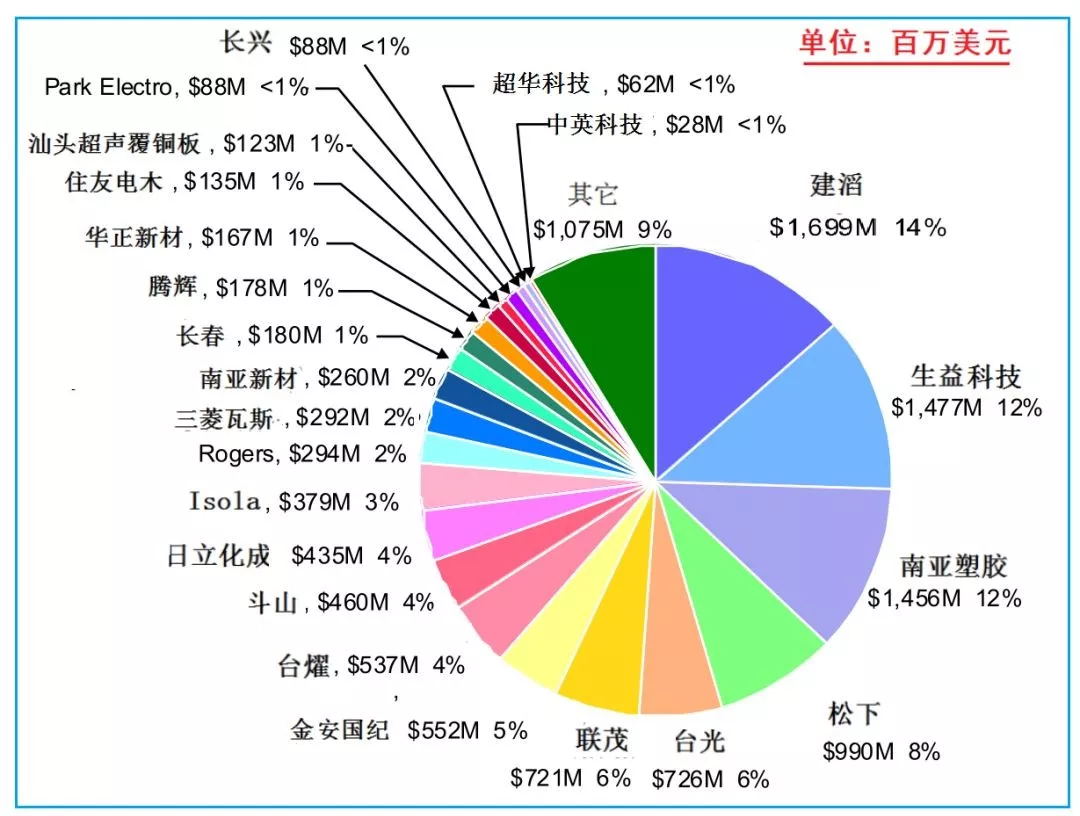
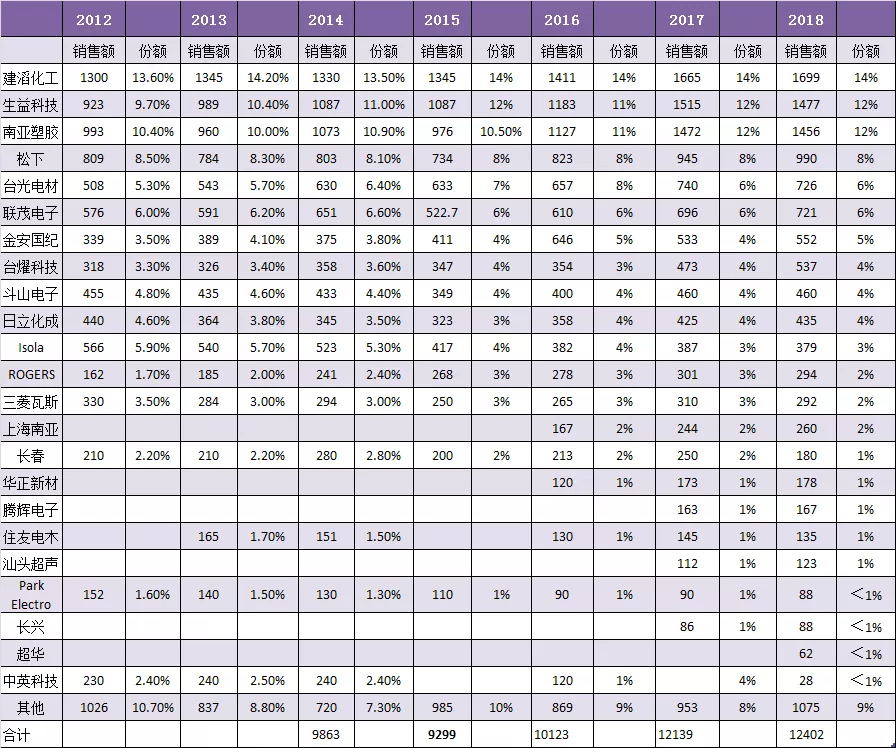
Prismark surveyed and ranked the top 23 firms in global sales in 2018 (see figure 4). From Table 7, we can see more clearly the change of the ranking of global rigid copper clad laminate companies from 2012 to 2018.
Figure 4 Sales and Shares of Main Rigid Copper Clad Enterprises (Top 23 Sales) in 2018
Note: Sales data excluding laminated prefabricated boards with inner cores for multilayer boards
Source: Prismark. 2019.6
Jiantao Chemical Group continues to rank first in the world with US$1.699 billion, accounting for 14% of the global share. In 2018, sales of Biotech declined slightly from a year earlier (annual growth rate was - 2.5% in 2018), ranking second in the world with $1.477 billion. South Asia plastics sales grew significantly in 2018, with a performance of $1.127 billion approaching the sales of Biotech in 2018, ranking third in the world (see table 7).
Table 7 Global Rigid Copper Clad Laminates Companies Ranking by Sales from 2012 to 2018
Unit: $1 million
Note: excluding prefabricated panels with inner core for multilayer PCB board
Source: Prismark. 2019.6